

Measures of Mortality

Healthy People 2030 (HP 2030) provides objectives to improve the nation’s health and wellbeing.5 This dashboard focuses on the mortality objectives of HP 2030 among San Diego County residents, and displays mortality trends, the most recent HP 2030 data, a HP 2030 status list, and a comparison to the United States and California. Filter for a demographic, condition, or HP 2030 status to view San Diego County’s progress in reducing mortality and meeting national objectives.
Healthy People 2030 and Mortality in San Diego
County Dashboard

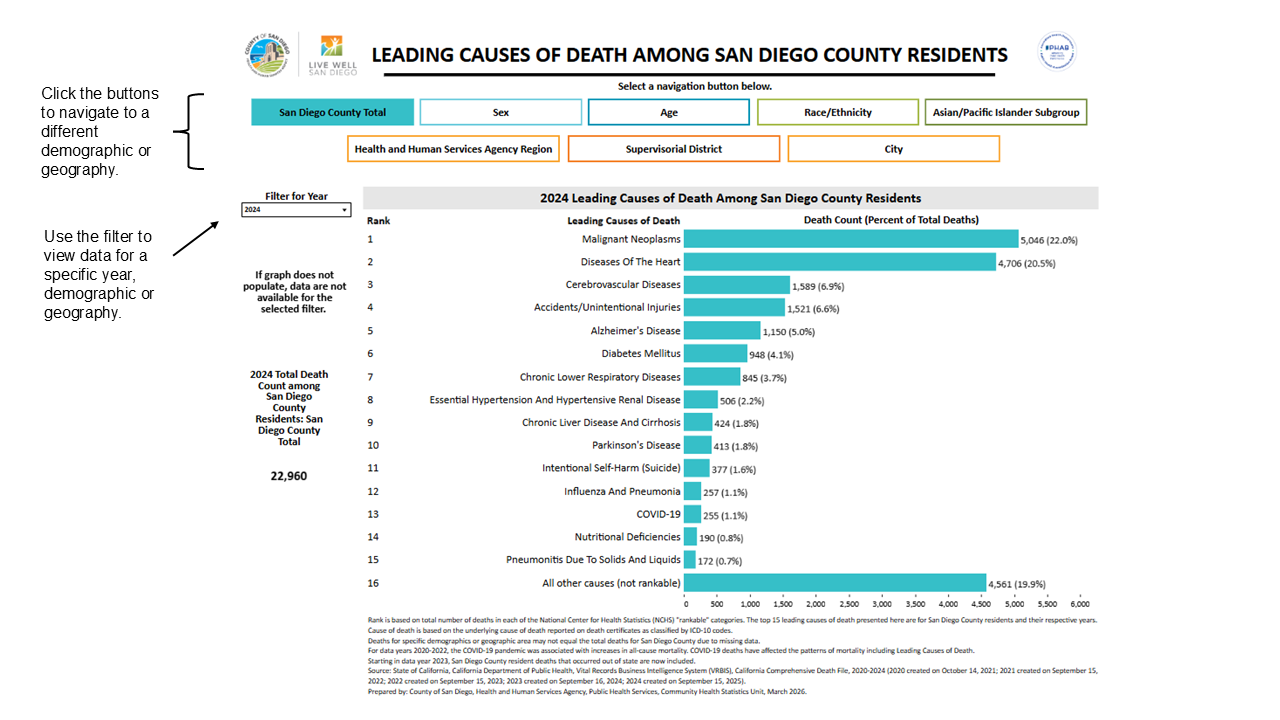
The leading cause of death rankings present the most frequently occurring causes of death in San Diego County. These measures show the relative burden of a specific cause of death compared to other causes. Rankings vary by geography, age, gender, race/ethnicity, and even vary over time.

While diseases of the heart, commonly known as heart disease, holds the spot as the #1 leading cause of death in the United States and in the state of California, Cancer continues to be the leading cause of death in San Diego County.
-
Leading Causes of Death Dashboard
The Leading Causes of Death dashboard displays the top leading causes of death among San Diego County Residents for their respective years. Rank is based on the total number of deaths in each of the National Center for Health Statistics (NCHS) “rankable” categories. The cause of death is based on the underlying cause of death reported on death certificates as classified by ICD-10 codes. The leading causes of death are displayed by total, sex, age, race/ethnicity, Asian/Pacific Islander subgroup, Health and Human Services Region (HHSA Region), supervisorial district, and city.
2020-2024 Leading Causes of Death among San Diego County Residents Dashboard
Refer to this image to learn to use the dashboard.
-
Leading Causes of Death Tables
Leading Causes of Death Tables by:
- San Diego County Leading Causes of Death 2020-2024
- Leading Causes of Death Tables by Sex, 2020-2024
- Leading Causes of Death Tables by Race/Ethnicity, 2020-2024
- Leading Causes of Death Tables by Age, 2020-2024
- Leading Causes of Death Tables by HHSA Region, 2020-2024
- Leading Causes of Death Tables by San Diego County Supervisorial District, 2020-2024
- Leading Causes of Death Tables by City, 2020-2024
Life expectancy is one of the Top 10 Indicators measured for the County of San Diego’s Live Well San Diego vision for healthier, safer, and thriving communities. This measure is a widely used indicator for the capability to live a long and healthy life and reflects the overall mortality of a population. The life expectancy brief includes life expectancy by gender, race/ethnicity, geography, and overall, for San Diego County.
Click button below for Life Expectancy Brief.


1 Centers for Disease Control and Prevention,
National Center for Health Statistics. National Vital Statistics
System, Provisional Mortality on CDC WONDER Online Database. Data
are from the final Multiple Cause of Death Files, 2018-2023, and
from provisional data for years 2024 and later, as compiled from
data provided by the 57 vital statistics jurisdictions through the
Vital Statistics Cooperative Program. Accessed at
http://wonder.cdc.gov/mcd-icd10-provisional.html on Feb 6, 2026.
2 U.S. Department of Health and Human Services. The Health Consequences of Smoking-50 Years of Progress (2014). The Health Consequences of Smoking - 50 Years of Progress: A Report of the Surgeon General (nih.gov).
3 Centers for Disease Control and Prevention (CDC), Smoking‐Attributable Mortality, Morbidity, and Economic Costs (SAMMEC) System (2014). http://www.ncbi.nlm.nih.gov/books/NBK294316/table/ch12.t4/?report=objectonly.
4 State of California, California Department of Public Health, Vital Records Business Intelligence System (VRBIS), California Comprehensive Death File, 2024, created on September 15, 2025.
5 U.S. Department of Health and Human Services, Office of
Disease Prevention and Health Promotion, Healthy People
2030, Healthy People 2030 | health.gov.


