

Health Data
The Community Health Statistics Unit (CHSU) offers health statistics, supporting decisions and prevention through detailed reports, visualizations, and predictive analytics.
Community Morbidity and Mortality Profiles contain a variety of health-related information in San Diego County and its communities. We currently have data for 2016 to 2024 deaths, hospitalizations, emergency department discharges, in-patient treatment discharges, physical rehabilitation, and skilled nursing facility discharges. Starting in data year 2023, the Community Morbidity and Mortality Profiles are divided into two separate files - mortality (death) and morbidity (hospitalization, emergency department discharge, and in-patient discharges).
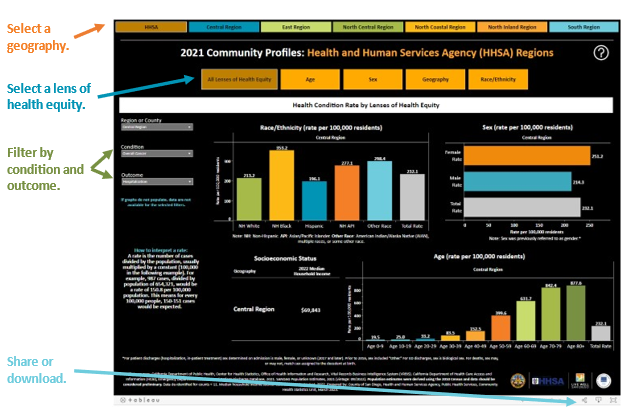
The 2024 Community Morbidity and Mortality Profiles are available online as dynamic Tableau dashboards, linked below. These dashboards help to visualize the health data by the lenses of health equity: age, sex, geography, socioeconomic status, and race/ethnicity for over 70 conditions. Data are available for the Health and Human Services Agency (HHSA) Regions and their respective subregional areas (SRAs), as well as for the 18 municipalities and the unincorporated area of San Diego County. Selected tabs can be downloaded as images and the entire profile can be downloaded as PDFs or PowerPoint slides.
Please click anywhere in the bars below to open it and access the links for prior years of the Community Morbidity and Mortality Dashboards and Excel Workbooks.
-
Community Morbidity and Mortality Profile Excel Workbooks
2023
2016-2022- Alzheimer's Disease and Related Dementias (ADRD)
- Behavioral Health Outcomes
- Communicable Diseases
- Non-Communicable (Chronic) Diseases
- Injuries
- Maternal and Child Health Outcomes

The Community Profiles Age-Adjusted Trends are interactive Tableau dashboards that help visualize the age-adjusted annual rates of disease and injury by geography, sex, and race/ethnicity in San Diego County. Approximately 70 conditions with 4 outcomes are available for the Health and Human Services Agency (HHSA) Regions and their subregional areas (SRAs), the 18 municipalities and the unincorporated area of San Diego County. Data have been updated through 2024.
Age-adjusted rates represent the rates expected for a population having the same age distribution (same age structure) as a reference population. These ‘age-standardized’ rates allow comparisons between different populations at one point in time, or one population at different times by controlling for age. For example, age-adjusted rates can help identify differences in rates of disease due to environmental factors, behavioral risk factors, or social determinants of health.
Age-Adjusted Morbidity Dashboards
Age-Adjusted Mortality Dashboards

The 2024 Community Profiles Data Guide and Data Dictionary Dashboards contain technical notes for users of the Community Profiles’ morbidity and mortality data. The data guide provides information for data users, describes geographic units used in health data, explains rates, age-adjusted rates, and confidence intervals. Additionally, the guide lists the data sources used to create the Community Profiles data and a variable guide for the data. There are five data dictionaries for the Community Profiles. The first is a morbidity data dictionary dashboard that provides a list of Clinical Classifications Software Refined (CCSR) category codes and descriptions and ICD-10-CM codes and descriptions used to categorize each condition with an emergency department discharge, hospitalization, or in-patient treatment outcome. The mortality data dictionary provides a list of ICD-10 mortality codes and descriptions that were used to categorize each condition with a death outcome. The third dashboard lists the classification type of each condition and outcome. The data standards dashboard is where you can find the standard, link to the standard, and notes for each condition and outcome. The final section is the log of updates which contains information on changes made to the Community Profiles data from year to year.
2024 Community Profiles Data Guide and Data Dictionary Dashboards
-
Archive - 2023 Community Profiles Data Guide
The 2023 Community Profiles Data Guide and Data Dictionary Dashboards contain technical notes for users of the Community Profiles’ morbidity and mortality data. The data guide provides information for data users, describes geographic units used in health data, explains rates, age-adjusted rates, and confidence intervals. Additionally, the guide lists the data sources used to create the Community Profiles data and a variable guide for the data. There are four data dictionaries for the Community Profiles. The first dashboard is a morbidity data dictionary dashboard, that provides a list of Clinical Classifications Software Refined (CCSR) category codes and descriptions, and ICD-10 CM codes and descriptions used to categorize each condition with an emergency department discharge, hospitalization, or in-patient treatment outcome. The second dashboard is a mortality data dictionary, which provides a list of ICD-10 mortality codes and descriptions that were used to categorize each condition with a death outcome. The third dashboard lists the classification type of each condition and outcome. The final dashboard is a data standards dashboard where you can find the standard, link to to the standard, and notes for each condition and outcome.
2023 Community Profiles Data Guide and Data Dictionary Dashboards
For previous years' health data,
visit our
archives.
For machine-readable data, visit the County of San Diego's data access portal.

Health Briefs are easy-to-read, printable health statistics by HHSA Region using data from the Community Profiles and the California Health Interview Survey (CHIS). Each health brief contains information on non-communicable diseases, communicable diseases, maternal & child health, injury, behavioral health, ADRD, environmental health, and access to care data.
Please click anywhere in the bar below to open it and access the links for prior years of the Health Briefs.
-
Health Briefs
2019 Health Briefs
- Central Region
- East Region
- North Central Region
- North Coastal Region
- North Inland Region
- South Region
2020 Health Briefs
- Central Region
- East Region
- North Central Region
- North Coastal Region
- North Inland Region
- South Region
2021 Health Briefs
- Central Region
- East Region
- North Central Region
- North Coastal Region
- North Inland Region
- South Region
2022 Health Briefs
- Central Region
- East Region
- North Central Region
- North Coastal Region
- North Inland Region
- South Region
The All Cause Morbidity Dashboard is an interactive Tableau
dashboard that helps visualize the all cause total
morbidity, emergency department, hospitalization, and in-patient
treatment discharge rates by age, race/ethnicity, sex, socioeconomic
status, and urbanicity in San Diego County. Morbidity is the amount of
disease in a population. In this analysis, total morbidity is defined
as the sum of all inpatient and outpatient discharges. The 2023
emergency department and patient discharge data were obtained from the
California Department of Health Care Access and Information (HCAI)
database.
2023 All Cause Morbidity Dashboard
Dashboard instructions here.
The Preventable Hospitalizations Dashboard displays potentially preventable hospitalizations among San Diego County resident adults by race, sex, and geography defined by Agency for Healthcare Research and Quality's (AHRQ) prevention quality indicators (PQIs) version 2024. AHRQ's prevention quality indicators are defined as hospital discharges due to specific chronic and acute conditions that could have been prevented if the individual received proper outpatient care. Hospital discharges are based on patient residency not on hospital location, and these indicators are not a reflection of hospital quality but rather, access to high quality outpatient care. PQIs are only one measure to identify the quality of patient care in the community.
2023 Preventable Hospitalizations Dashboard
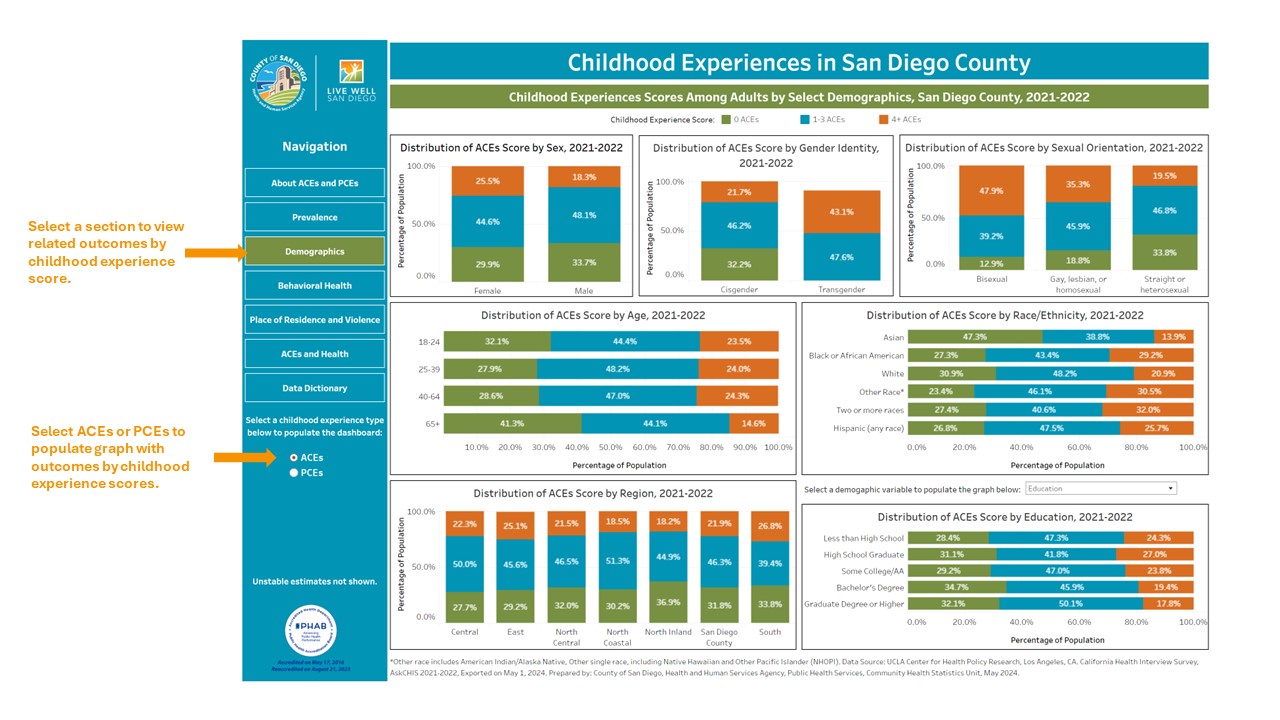
Both Adverse Childhood Experiences (ACEs) and Positive Childhood Experiences (PCEs) impact health outcomes in adulthood. ACEs are potentially traumatic experiences that occur before the age of 18. PCEs are defined as having supportive and nurturing environments in childhood, such as strong peer relationships, supportive school environments, or safe neighborhoods. Current research indicates that experiencing a higher number of ACEs is associated with chronic health conditions, mental illness, and health risk behaviors, while PCEs are strongly associated with improved mental and physical health in adulthood. Further, PCEs may have protective effects against adverse health and well-being outcomes in adulthood among adults who were exposed to ACEs. Currently, ACEs are measured through a variety of surveys. The data provided in the Childhood Experiences dashboard are from the California Health Interview Survey (CHIS).
The interactive Childhood Experiences Tableau
dashboard helps to visualize demographic and health outcome data
disaggregated by ACE and PCE scores for San Diego County adults. The
accompanying brief provides a background of ACEs and PCEs and their
relationship to health and well-being. Additionally, the brief
highlights the disparities found in ACEs and PCEs prevalence among
adults in San Diego County.

Non-Hispanic Asian Health and Well-Being
The Non-Hispanic Asian Brief and Dashboard present information about the health and well-being of non-Hispanic Asian residents living in San Diego County. Topics presented include demographics, social determinants of health, health status, health behaviors, injury and violence, medical encounter and death rates, and maternal and child health.

Non-Hispanic Native Hawaiian/Pacific Islander Health and Well-Being
The Non-Hispanic Native Hawaiian/Pacific Islander Brief and
Dashboard present information about the demographics and health of
non-Hispanic Native Hawaiian/Pacific Islander residents living in San
Diego County. Topics presented include demographic characteristics,
medical encounter and death data, and maternal and child health
indicators.

The Tribal Brief and Dashboard present information about the
health and well-being of American Indian/Alaska Native (AIAN)
residents living in San Diego County. The information presented
includes demographics, social determinants of health, health status,
and health behaviors aggregated for 2019-2023 from the California
Health Interview Survey. Medical encounter and death rates, select
maternal and child health indicators, and incidence of communicable
diseases are also visualized. These data may support community
health improvement measures and identify high-priority health
areas.

Chronic diseases are now the major cause of death and disability worldwide, having surpassed infectious diseases and injuries. This reflects an improvement in the prevention and treatment of infectious diseases and significant changes in dietary habits, physical activity levels, and tobacco use in the population.2 Three behaviors (poor diet, physical inactivity, and tobacco use) contribute to four chronic diseases (cancer, heart disease and stroke, type 2 diabetes, and pulmonary diseases such as asthma) that cause over 50 percent of all deaths worldwide. This is the foundation of the 3-4-50 concept.3 The influence of these three unhealthy behaviors may be seen in San Diego County as these four chronic diseases are the most common causes of death and disability in our region.
Use the "Expand 3-4-50 Products" button below and navigate to the product of interest: 3-4-50 trended dataset, presentation, short briefs, detailed briefs, and chronic disease maps, or use the "Collapse" button to hide the content.
Expand 3-4-50 Products | Collapse
-
3-4-50 Dataset
The 3-4-50 Dataset is an excel workbook providing the 3-4-50 percents and rates for San Diego County by HHSA Regions, Subregional Areas (SRAs), Cities, and Supervisor Districts from 2014 to 2023.
-
3-4-50 Presentation
The 3-4-50: Chronic Disease Deaths Presentation is a collection of slides describing the 3-4-50 concept and its trend in San Diego County, its Health and Human Services Agency (HHSA) Regions, and subregional areas (SRAs) from 2000 to 2023.
-
3-4-50 Short Briefs
The 3-4-50 Short Briefs are printable handouts that summarize the burden of chronic disease by HHSA Region and San Diego County overall from 2000 to 2023.
- Central Region Short Brief
- East Region Short Brief
- North Central Region Short Brief
- North Coastal Region Short Brief
- North Inland Region Short Brief
- South Region Short Brief
- San Diego County Short Brief
-
3-4-50 Detailed Briefs
3-4-50 Detailed Briefs give a more detailed look at the burden of chronic disease from 2000 to 2023 for San Diego County overall, municipalities and the unincorporated area, and by HHSA Region.
- Central Region Detailed Brief
- East Region Detailed Brief
- North Central Region Detailed Brief
- North Coastal Region Detailed Brief
- North Inland Region Detailed Brief
- South Region Detailed Brief
- San Diego County Detailed Brief
- Municipalities and Unincorporated Area Detailed Brief
-
Chronic Disease Maps
Maps for the 3-4-50 chronic diseases, as well as other chronic diseases, can be accessed by clicking the phrase "Chronic Diseases in San Diego County Maps" below.
Chronic Diseases in San Diego County Maps
The Payer Source Dashboards display hospitalization and emergency department data by expected payer sources, including Medicaid/Medi-Cal and Medicare. Hospitalization and emergency department data includes demographics, admission summaries, and primary diagnoses by race/ethnicity, age group, and sex. These data are specific to residents in San Diego County who were admitted into the emergency department or hospital with health insurance covered by Medicaid/Medi-Cal and/or Medicare.
Payer Source Dashboard: Emergency Department Discharges (2021-2023)


1 World Health Organization (WHO). “The Global Strategy on Diet, Physical Activity and Health.” http://www.who.int/dietphysicalactivity/media/en/gsfs_general.pdf (Accessed September 22, 2011).
2 3Four50, www.3four50.com (Accessed September 22, 2011).
Dashboard instructions here.


