

City Demographics and Health Statistics

The Community Health Statistics Unit produces demographic and health data at the municipality level to help planners, community partners, jurisdictions, and the public identify needs and focus areas.
Additionally, it supports the San Diego County Kresge Initiative, an ongoing effort for City and County leaders to work more closely together to identify and focus on mutual goals to improve health outcomes for our local region.
*Note: map depicts the San Diego County jurisdictions (18 cities and
the
unincorporated area), one of the many geographic levels we
depict data in.
The City Demographic and Health Profiles include sociodemographic and economic information for the specified municipality in addition to health data with comparisons to San Diego County. These profiles are updated annually with the most recent data available.
Please click "expand all" or click anywhere in the bar below to open it and access the links for the Demographic Profiles for prior years.
-
2025 City Demographic and Health Profiles
- 2025 City of Carlsbad
- 2025 City of Chula Vista
- 2025 City of Coronado
- 2025 City of Del Mar
- 2025 City of El Cajon
- 2025 City of Encinitas
- 2025 City of Escondido
- 2025 City of Imperial Beach
- 2025 City of La Mesa
- 2025 City of Lemon Grove
- 2025 City of National City
- 2025 City of Oceanside
- 2025 City of Poway
- 2025 City of San Diego
- 2025 City of San Marcos
- 2025 City of Santee
- 2025 City of Solana Beach
- 2025 City of Vista
- 2025 Unincorporated Area
-
2023 City Demographic and Health Profiles
- 2023 City of Carlsbad
- 2023 City of Chula Vista
- 2023 City of Coronado
- 2023 City of Del Mar
- 2023 City of El Cajon
- 2023 City of Encinitas
- 2023 City of Escondido
- 2023 City of Imperial Beach
- 2023 City of La Mesa
- 2023 City of Lemon Grove
- 2023 City of National City
- 2023 City of Oceanside
- 2023 City of Poway
- 2023 City of San Diego
- 2023 City of San Marcos
- 2023 City of Santee
- 2023 City of Solana Beach
- 2023 City of Vista
- 2023 Unincorporated Area
-
2022 City Demographic and Health Profiles
- 2022 City of Carlsbad
- 2022 City of Chula Vista
- 2022 City of Coronado
- 2022 City of Del Mar
- 2022 City of El Cajon
- 2022 City of Encinitas
- 2022 City of Escondido
- 2022 City of Imperial Beach
- 2022 City of La Mesa
- 2022 City of Lemon Grove
- 2022 City of National City
- 2022 City of Oceanside
- 2022 City of Poway
- 2022 City of San Diego
- 2022 City of San Marcos
- 2022 City of Santee
- 2022 City of Solana Beach
- 2022 City of Vista
- 2022 Unincorporated Area
In the United States, it is estimated that medical care accounts for only 10-20 percent of the modifiable contributors to healthy outcomes in a population. The other 80-90 percent are “the conditions in which people are born, grow, live, work and age, and the systems put in place to deal with illness,” known as social determinants of health (SDOH).1 This means that a significant proportion of disease burden within a community is shaped by SDOH, such as distribution of income, housing status, and access to healthcare.
The Demographic Profiles are a compilation of information relating to demographic characteristics of specific populations in San Diego County, including SDOH. Each Profile contains demographic data for each city and unincorporated area, including age, gender, race/ethnicity distributions, school enrollment, educational attainment, income, occupation, housing, and other SDOH. Many of these factors have been implicated at the roots of health disparities. The profiles are designed to help jurisdictions, HHSA staff in each of the Health and Human Services Regions (Regions) and other local organizations, including Live Well San Diego recognized partners, identify, and prioritize needs within their communities.
The demographic profiles below contain the most recent demographic and economic data available by Health and Human Services (HHSA) region, city, and supervisorial district in PDF format. Since 2020, the Demographic Profiles are also available online as dynamic Tableau dashboards.
2023 Demographic Profiles
Please click "expand all" or click anywhere in the bar below to open it and access the links for the Demographic Profiles for prior years.
-
Demographic Profiles (PDFs and Dashboards) by Year
20232022
2021
2020
2019
2018

The Demographic Older Adult Profiles are subset of the larger demographic profiles document for San Diego County. This profile set reflects data covering demographic and economic data on seniors available for municipalities and the unincorporated area.
2023 Demographic Profiles: Older Adult Subset - Municipalities and Unincorporated Area
Please click "expand all" or click anywhere in the bar below to open it and access the links for the Older Adult Subsets of the Demographic Profiles for prior years.
-
City Demographic Older Adult Profiles
2019-2022 Demographic Profiles: Older Adult Subsets
The Community Profiles contain a variety of health-related information in San Diego County and its communities. We currently have data for 2016 to 2023 deaths, hospitalizations, emergency department discharges, in-patient treatment discharges, physical rehabilitation, and skilled nursing facility discharges. Starting in data year 2023, the Community Morbidity and Mortality Profiles are divided into two, separate files - mortality (death) and morbidity (hospitalization, emergency department discharge, and in-patient discharges).
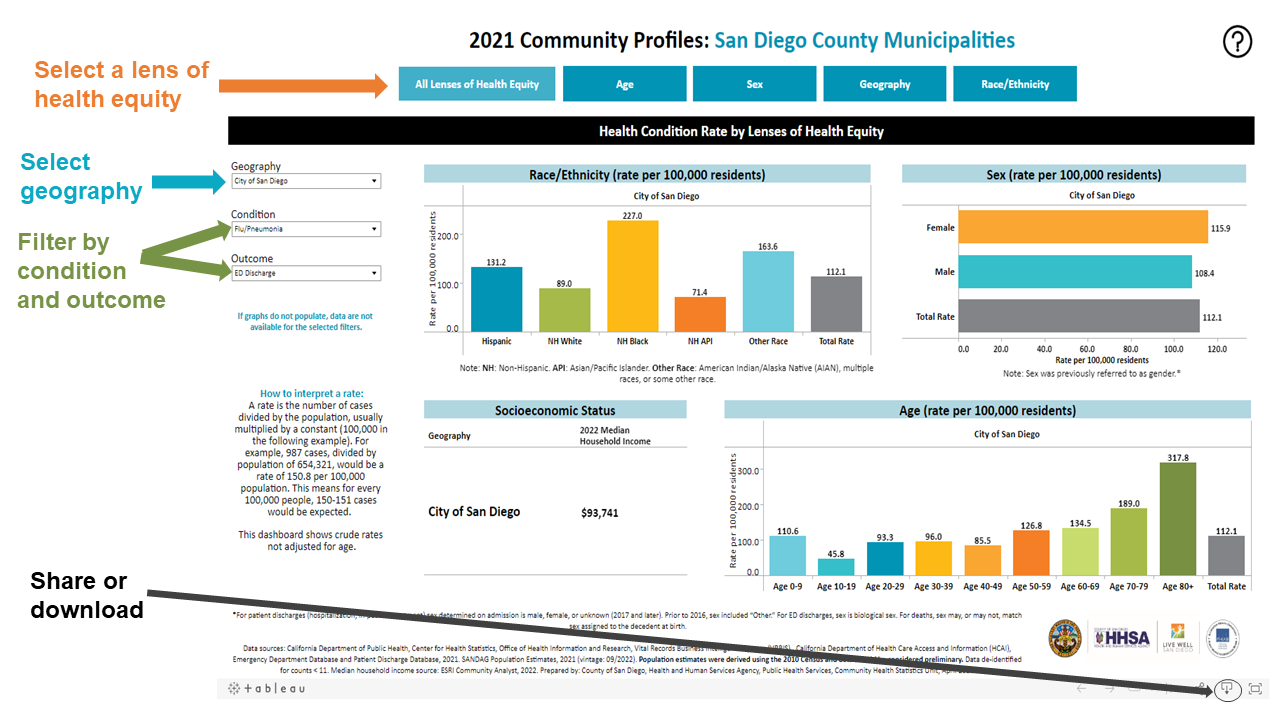
The 2023 Community Morbidity and Mortality Profiles are available online as dynamic Tableau dashboards, linked. These dashboards help to visualize the health data by the lenses of health equity: age, sex, geography, socioeconomic status, and race/ethnicity. There are over 70 conditions with four outcomes available (death, hospitalization, emergency department discharge, and in-patient treatment discharges). Data are available for the Health and Human Services Agency (HHSA) Regions and their respective subregional areas (SRAs), as well as for the 18 municipalities and the unincorporated area of San Diego County. Selected tabs can be downloaded as images and the entire profile can be downloaded as PDFs or PowerPoint slides.
Please click anywhere in the bars below to open it and access the links for prior years of the Community Morbidity and Mortality Dashboards and Excel Workbooks.
-
Community Morbidity and Mortality Profile Excel Workbooks
20232016-2022
- Alzheimer's Disease and Related Dementias (ADRD)
- Behavioral Health Outcomes
- Communicable Diseases
- Non-Communicable (Chronic) Diseases
- Injuries
- Maternal and Child Health Outcomes

The Community Profiles Age-Adjusted Trends are interactive Tableau dashboards that help visualize the age-adjusted annual rates of disease and injury by geography, sex, and race/ethnicity in San Diego County. Approximately 70 conditions with 4 outcomes are available for the Health and Human Services Agency (HHSA) Regions and their subregional areas (SRAs), the 18 municipalities and the unincorporated area of San Diego County. Data have been updated through 2023.
Age-adjusted rates represent the rates expected for a population having the same age distribution (same age structure) as a reference population. These ‘age-standardized’ rates allow comparisons between different populations at one point in time, or one population at different times by controlling for age. For example, age-adjusted rates can help identify differences in rates of disease due to environmental factors, behavioral risk factors, or social determinants of health.
Age-Adjusted Morbidity Dashboards
Age-Adjusted Mortality Dashboards

The 2024 Community Profiles Data Guide and Data Dictionary Dashboards contain technical notes for users of the Community Profiles’ morbidity and mortality data. The data guide provides information for data users, describes geographic units used in health data, explains rates, age-adjusted rates, and confidence intervals. Additionally, the guide lists the data sources used to create the Community Profiles data and a variable guide for the data. There are five data dictionaries for the Community Profiles. The first is a morbidity data dictionary dashboard that provides a list of Clinical Classifications Software Refined (CCSR) category codes and descriptions and ICD-10-CM codes and descriptions used to categorize each condition with an emergency department discharge, hospitalization, or in-patient treatment outcome. The mortality data dictionary provides a list of ICD-10 mortality codes and descriptions that were used to categorize each condition with a death outcome. The third dashboard lists the classification type of each condition and outcome. The data standards dashboard is where you can find the standard, link to the standard, and notes for each condition and outcome. The final section is the log of updates which contains information on changes made to the Community Profiles data from year to year.
2024 Community Profiles Data Guide and Data Dictionary Dashboards
Please click anywhere in the bars below to open it and access the links for prior years of the Data Guides and Dictionaries.

The Leading Causes of Death dashboard displays the top leading causes of death among San Diego County Residents for their respective years. Rank is based on the total number of deaths in each of the National Center for Health Statistics (NCHS) “rankable” categories. The cause of death is based on the underlying cause of death reported on death certificates as classified by ICD-10 codes. The leading causes of death are displayed by total, sex, age, race/ethnicity, Asian/Pacific Islander subgroup, Health and Human Services Region (HHSA Region), supervisorial district, and city.


Chronic diseases are now the major cause of death and disability worldwide, having surpassed infectious diseases and injuries. This reflects an improvement in the prevention and treatment of infectious diseases and significant changes in dietary habits, physical activity levels, and tobacco use in the population.2 Three behaviors (poor diet, physical inactivity, and tobacco use) contribute to four chronic diseases (cancer, heart disease and stroke, type 2 diabetes, and pulmonary diseases such as asthma) that cause over 50 percent of all deaths worldwide. This is the foundation of the 3-4-50 concept. 3 The influence of these three unhealthy behaviors may be seen in San Diego County as these four chronic diseases are the most common causes of death and disability in our region.
3-4-50 Datasets
-
The 3-4-50 Dataset is an excel workbook providing the 3-4-50 percents and rates for San Diego County by HHSA Regions, Subregional Areas (SRAs), Cities, and Supervisor Districts from 2014 to 2023.
3-4-50 Detailed Briefs

The Detailed Brief explores the burden of 3-4-50 chronic diseases from 2000-2023 for Municipalities and the Unincorporated Area.

Injury collisions are those involving a motor vehicle operated on a public road, where at least one person is injured or killed. This dashboard shows the rates of several injury indicators related to motor vehicle collisions in San Diego County for 2020. Where available, counts and rates are provided by sex, age group, and geography. Geographical areas included are San Diego County, 18 municipalities (cities) and the unincorporated area.
Motor Vehicle Collision Injury Indicators for Cities & Unincorporated Area
Outcomes on this dashboard:
- Alcohol-Involved Injuries
- Drinking Driver
- Pedalcycle Injuries
- Pedestrian Injuries
- Total Injuries
The Big Cities Health Inventory Platform features data on 35 of the largest and most urban cities in the nation, including City of San Diego. On this platform, you can explore and compare cities on topics such as demographics, social and economic factors, access to health services, infectious and sexually transmitted diseases, chronic diseases, violence and injury, mental health and substance use, and more!
1 Magnan, S. 2017. Social Determinants of Health 101 for Health Care: Five Plus Five. NAM Perspectives. Discussion Paper, National Academy of Medicine, Washington, DC. https://doi.org/10.31478/201710c
2 World Health Organization (WHO). “The Global Strategy on Diet, Physical Activity and Health.” http://www.who.int/dietphysicalactivity/media/en/gsfs_general.pdf (Accessed September 22, 2011).
3 3Four50, www.3four50.com (Accessed September 22, 2011).


