

Archives
Welcome to the Community Health Statistics Unit page for archived information. If you cannot find what you are looking for, you can contact us for assistance!
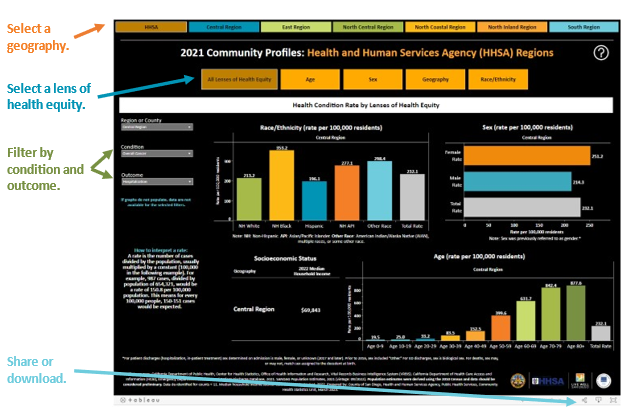
Community Profiles contain data for deaths, hospitalizations, emergency department discharges, in-patient treatment discharges, physical rehabilitation, and skilled nursing facility discharges for San Diego County and its communities.
The Community Profiles are available online as dynamic Tableau dashboards, linked below. These dashboards help to visualize the health data by the lenses of health equity: age, sex, geography, socioeconomic status, and race/ethnicity. There are over 70 conditions with four outcomes available (death, hospitalization, emergency department discharge, and in-patient treatment discharges). Data are available for the Health and Human Services Agency (HHSA) Regions and their respective subregional areas (SRAs), as well as for the 18 municipalities and the unincorporated area of San Diego County. Selected tabs can be downloaded as images and the entire profile can be downloaded as PDFs or PowerPoint slides.
Please click anywhere in the bars below to open it and access the links for prior years of the Community Morbidity and Mortality Dashboards and Excel Workbooks.
-
Community Morbidity and Mortality Profile Excel Workbooks
2016-2022
- Alzheimer's Disease and Related Dementias (ADRD)
- Behavioral Health Outcomes
- Communicable Diseases
- Non-Communicable (Chronic) Diseases
- Injuries
- Maternal and Child Health Outcomes

The Community Profiles Data Guide and Data Dictionary Dashboards contain technical notes for users of the Community Profiles’ morbidity and mortality data. The data guide provides information for data users, describes geographic units used in health data, explains rates, age-adjusted rates, and confidence intervals. Additionally, the guide lists the data sources used to create the Community Profiles data and a variable guide for the data. There are four data dictionaries for the Community Profiles. The first dashboard is a morbidity data dictionary dashboard, that provides a list of Clinical Classifications Software Refined (CCSR) category codes and descriptions, and ICD-10 CM codes and descriptions used to categorize each condition with an emergency department discharge, hospitalization, or in-patient treatment outcome. The second dashboard is a mortality data dictionary, which provides a list of ICD-10 mortality codes and descriptions that were used to categorize each condition with a death outcome. The third dashboard lists the classification type of each condition and outcome. The final dashboard is a data standards dashboard where you can find the standard, link to to the standard, and notes for each condition and outcome.
Please click anywhere in the bar below to open it and access the links for prior years of the Data Guides and Dictionaries.
For machine-readable data, visit the County of San Diego's data access portal.

Health Briefs are easy-to-read, printable health statistics by HHSA Region using data from the Community Profiles and the California Health Interview Survey (CHIS). Each health brief contains information on non-communicable disease, communicable disease, ADRD, maternal & child health, injury, and behavioral health data.
-
Health Briefs
2019 Health Briefs
- Central Region
- East Region
- North Central Region
- North Coastal Region
- North Inland Region
- South Region
2020 Health Briefs
- Central Region
- East Region
- North Central Region
- North Coastal Region
- North Inland Region
- South Region
2021 Health Briefs
- Central Region
- East Region
- North Central Region
- North Coastal Region
- North Inland Region
- South Region
2022 Health Briefs
- Central Region
- East Region
- North Central Region
- North Coastal Region
- North Inland Region
- South Region
The Demographic Profiles provide information on the demographic characteristics of specific populations in San Diego County, including social determinants of health (SDOH). Each Profile contains demographic data, including age, gender, race/ethnicity distributions, school enrollment, educational attainment, income, occupation, housing, and other SDOH. Many of these factors have been identified as contributors to health disparities. The profiles are designed to help HHSA staff in each of the Health and Human Services Regions (Regions) and other local organizations, including Live Well San Diego recognized partners, identify and prioritize needs within their communities.
The Demographic Profiles include the latest demographic and economic data available by Health and Human Services (HHSA) region, city, and supervisorial district in PDF format. The Demographic Profiles are also available as dynamic Tableau dashboards, with an additional dashboard on demographic data at the census tract level.
Please click "expand all" or click anywhere in the bar below to open it and access the links for the Demographic Profiles for prior/archived years.
-
Demographic Profiles (PDFs and Dashboards) by Year
2023
- 2023 Region/SRA Demographic Profiles
- 2023 Region/SRA Demographic Profiles Dashboard
- 2023 City Demographic Profiles
- 2023 City Demographic Profiles Dashboard
- 2023 Supervisorial District Demographic Profiles
- 2023 Supervisorial District Demographic Profiles Dashboard
- 2023 Census Tract Demographic Profile Dashboard
2022- 2022 Supervisorial District Demographic Profiles
- 2022 Supervisorial District Demographic Profiles Dashboard
2022- 2022 Supervisorial District Demographic Profiles
- 2022 Supervisorial District Demographic Profiles Dashboard
2021
- 2021 Supervisorial District Demographic Profiles
- 2021 Supervisorial District Demographic Profiles Dashboard
2020
- 2020 Supervisorial District Demographic Profiles
- 2020 Supervisorial District Demographic Profiles Dashboard
2019
- 2019 Region/SRA Demographic Profiles
- 2019 City Demographic Profiles
- 2019 Supervisorial District Demographic Profiles
2018

Currently, the U.S. government classifies Middle Eastern and North African (MENA) individuals as White under Directive No. 15: Standards for Maintaining, Collecting, and Presenting Federal Data on Race and Ethnicity (SPD 15). The San Diego County MENA Population by Ancestry and Place of Birth Profile examines the MENA population through ancestry and birthplace due to the absence of a direct estimation method.
Please click "expand all" or click anywhere in the bar below to open it and access the links for the MENA Profiles of prior years.
For machine-readable data, visit the County of San Diego's data access portal.

Cost of Living for Older Adults
Cost of living can vary by age. The cost of living tool below helps to highlight the economic issues faced by the aging population in San Diego County. It helps determine the basic costs of living for older adults (those aged 65 years and over) and to visualize the amount spent on basic necessities for older adults in each Health and Human Services Agency (HHSA) region, subregional area (SRA), and San Diego County overall. Select household composition, housing tenure, and geography to explore the differences in the expenditure on basic necessities. The briefs provide background information and key findings from the data included in the dashboard.
-
Cost of Living for Older Adults, 2023
Cost of Living for Older Adults
Cost of living can vary by age. The cost of living tool below helps to highlight the economic issues faced by the aging population in San Diego County. It helps determine the basic costs of living for older adults (those aged 65 years and over) and to visualize the amount spent on basic necessities for older adults in each Health and Human Services Agency (HHSA) region, subregional area (SRA), and San Diego County overall. Select household composition, housing tenure, and geography to explore the differences in the expenditure on basic necessities. The briefs provide background information and key findings from the data included in the dashboard.
Cost of Living for Older Adults, San Diego County, 2023 Brief
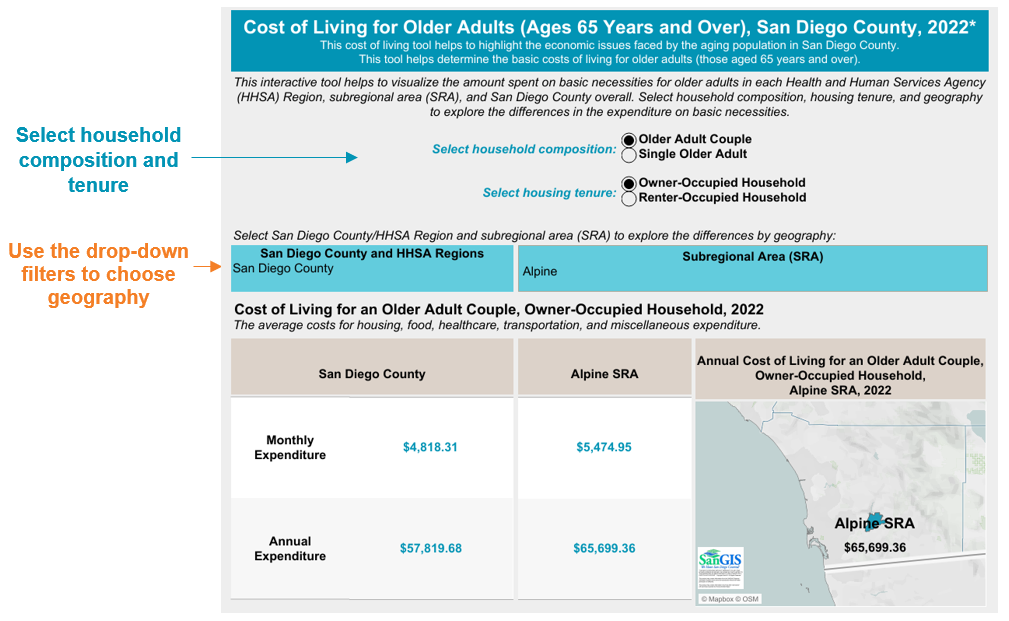
See the below images to learn how to use the Cost of Living for Older Adults Dashboard:
Dashboard instructions here.
-
Cost of Living for Older Adults, 2022
Cost of living can vary by age. The cost of living tool below helps to highlight the economic issues faced by the aging population in San Diego County. It helps determine the basic costs of living for older adults (those aged 65 years and over) and to visualize the amount spent on basic necessities for older adults in each Health and Human Services Agency (HHSA) region, subregional area (SRA), and San Diego County overall. Select household composition, housing tenure, and geography to explore the differences in the expenditure on basic necessities. The briefs provide background information and key findings from the data included in the dashboard.
Cost of Living for Older Adults, San Diego County, 2022 Brief
Dashboard instructions here.

Self-Sufficiency Standard
Currently, the federal government’s poverty thresholds and guidelines are used to determine poverty rates throughout the United States. While the measure is defined as the minimum amount of annual income that is needed for individuals and families to pay for essentials, its calculation does not consider essential household expenses such as housing, medical, and childcare costs, or the geographic variability in the cost of living.8 The self-sufficiency standard is an affordability measure that serves as an alternative to the federal government’s poverty thresholds.9 The self-sufficiency standard measures how much income is needed for a household of a certain composition to adequately meet their basic needs without public or private assistance.
The self-sufficiency standard dashboard below is an interactive tool that helps to visualize the minimum wage required for self-sufficiency based on the average amount spent on basic necessities in each Health and Human Services Agency (HHSA) region, subregional area (SRA), and San Diego County overall. The self-sufficiency briefs provide background and key findings from the data included in the dashboards.
2023 Socioeconomic Status Dashboard Series: San
Diego County Self-Sufficiency Standard Dashboard
See the below images to learn how to use the San Diego County Self-Sufficiency Standard Dashboard:
-
2023 San Diego County Self-Sufficiency Standard Briefs
-
San Diego County Self-Sufficiency Standard Brief:
Single-Adult Household, 2023
- San Diego County Self-Sufficiency Standard Brief: Household with Two Adults and Two Children, 2023
- San Diego County Self-Sufficiency Standard Brief: Household with Two Adults, 2023
- San Diego County Self Sufficiency Standard Brief: Single Parent Household with Two Children, 2023
-
San Diego County Self-Sufficiency Standard Brief:
Single-Adult Household, 2023

-
Self-Sufficiency Standard, 2022
San Diego County Self-Sufficiency Standard Brief: Single-Adult Household, 2022
San Diego County Self-Sufficiency Standard Brief: Household with Two Adults and Two Children, 2022
San Diego County Self-Sufficiency Standard Brief: Household with Two Adults, 2022
San Diego County Self Sufficiency Standard Brief: Single Parent Household with Two Children, 2022
Socioeconomic Status Dashboard Series: San Diego County Self-Sufficiency Standard Dashboard, 2022
Dashboard instructions here.

Persons Experiencing Homelessness (PEH)
Persons experiencing homelessness (PEH) face a variety of health risks, including poverty, chronic disease, overcrowding in shelters, poor mental health, and substance use disorders.10 Collection and examination of data identifying PEH and their health outcomes is crucial to understanding this population’s health disparities.

Lesbian, Gay, Bisexual, Transgender, and Queer (LGBTQ) Population
Individuals who identify as lesbian, gay, bisexual, transgender, or queer (LGBTQ) are diverse and include people of all demographic backgrounds. Members of the LGBTQ community are at increased risk for a number of poor health outcomes compared to heterosexual and cisgender people as a result of social and structural inequities.11
-
Lesbian, Gay, Bisexual, Transgender, and Queer (LGBTQ) Population
The LGBTQ Briefs below provide demographic, health and well-being, and healthcare access data disaggregated by sexual orientation and gender identity. Data for the adult population comes from the California Health Interview Survey (CHIS), 2016-2020, and data for the youth population is from the Youth Risk Behavior Surveillance System (YRBSS), 2015-2019.
The Adult LGBQ Population in San Diego County Brief, 2016-2020
The LGBT Youth Population in San Diego Unified School District, 2015-2019
Economic Hardship Index
Subregional Area (SRA)
Economic Hardship Index (EHI): Index of economic conditions based on crowded housing, dependency, education, income, poverty, and unemployment, with a higher value indicating worse economic conditions.1-3 This map helps visualize the estimated EHI by subregional area in San Diego County. The estimated EHI compares economic conditions between subregional areas.
Download a PDF version of the 2022 Economic Hardship Index Fact Sheet.
Download a PDF version of the 2022 Economic Hardship Index by Subregional Area map.

*Estimated economic hardship index values
were calculated based on aggregating census tract data.
1. America’s Health Rankings analysis of U.S. Census Bureau, American
Community Survey, United Health Foundation,
AmericasHealthRankings.org, accessed 2023.
2. Montiel LM, Nathan
RP, Wright DJ. An update on urban hardship. Albany (NY): The Nelson A.
Rockefeller Institute of Government; 2004.
3. Nathan, Richard
P., and Charles Adams. 1976. “Understanding Central City Hardship.”
Political Science Quarterly 91 (1): 47–62. https://doi.org/10.2307/2149158.
Census Tracts
The Economic Hardship Index (EHI) by Census Tract, 2023 Dashboard contains a map of the distribution of the EHI across census tracts in San Diego County. The estimated Economic Hardship Index by census tract map (see map below) shows the variation in levels of economic hardship and allows identification of communities with greater economic hardship. The dashboard provides the data for each of the components of EHI and the life expectancy of the subregional area (SRA) and HHSA Region the census tract is in. Additionally, the dashboard ranks the census tracts from highest to lowest EHI.
View the Economic Hardship Index (EHI) by Census Tract, 2023 Dashboard

Life expectancy is one of the Top 10 Indicators measured for the County of San Diego’s Live Well San Diego vision for healthier, safer, and thriving communities. This measure is a widely used indicator for the capability to live a long and healthy life and reflects the overall mortality of a population. The life expectancy brief includes life expectancy by gender, race/ethnicity, geography, and overall, for San Diego County.
Click button below for Life Expectancy Brief.

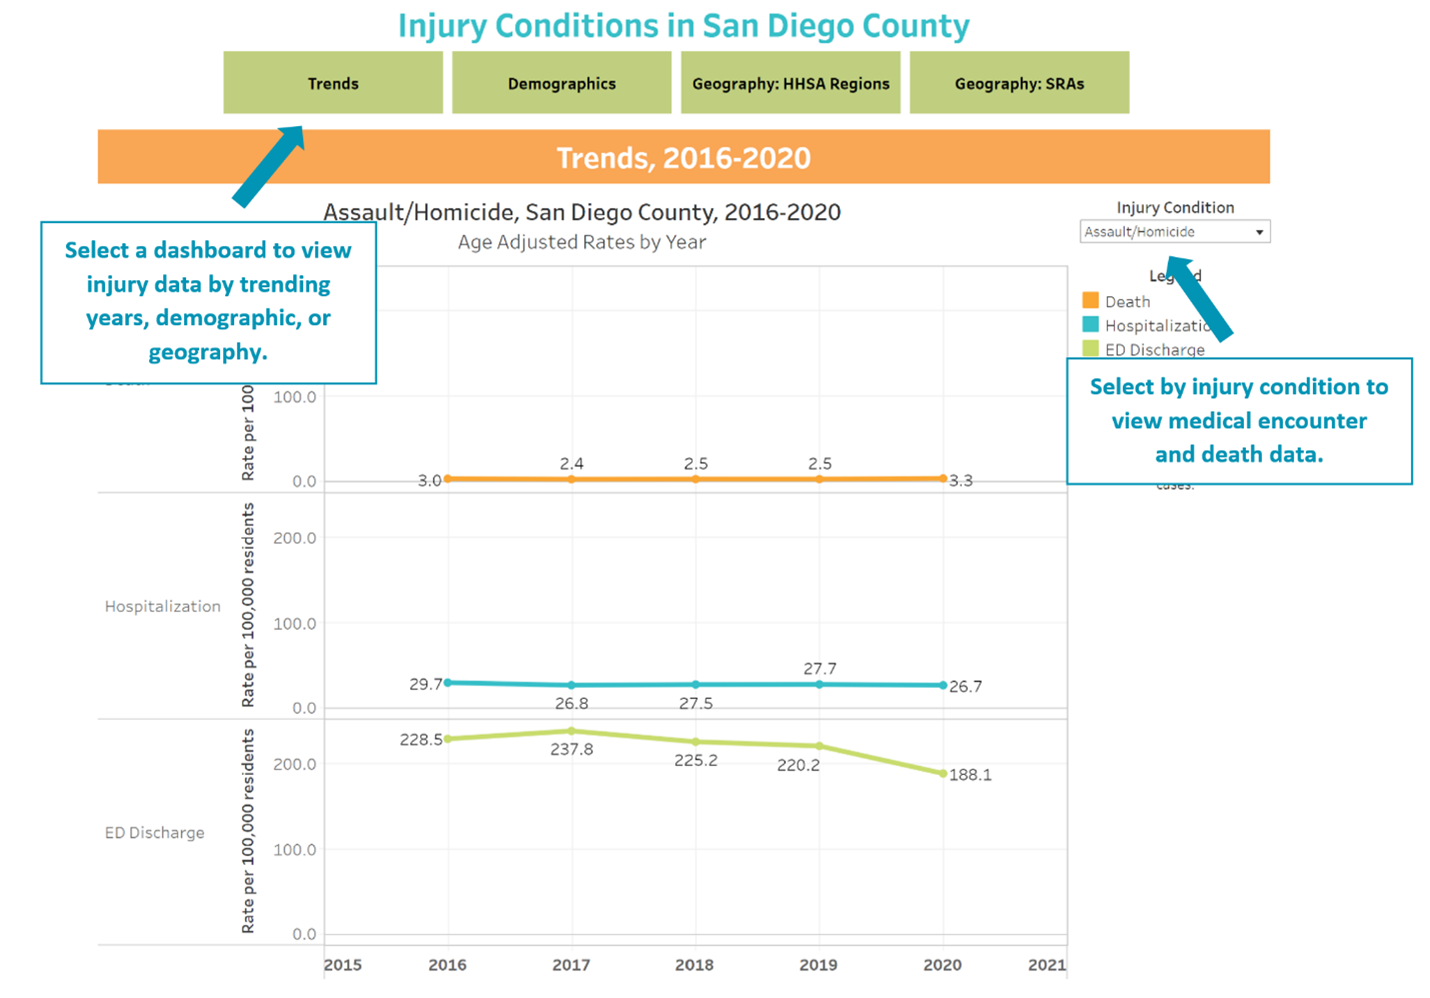
Injury Report and Dashboard
The 2020 Injury Report and Dashboard present information about injury-related conditions among residents living in San Diego County. The information presented includes injury indicators annual age-adjusted rates across years, crude rates by demographics (age, sex, and race/ethnicity), and by subregional areas (SRAs) and Health and Human Services Agency (HHSA) Regions.
Refer to this image to learn to use the dashboard.
8 Center for Women’s Welfare (CWW). Self-Sufficiency Standard.
http://www.selfsufficiencystandard.org/
9 Regional Task Force for Homelessness, Point-in-Time Count, 2023. https://www.rtfhsd.org/reports-data/
10 National Health Care for the Homeless Council, Frequently Asked Questions, 2022. https://nhchc.org/understanding-homelessness/faq/
11
Centers
for Disease Control and Prevention (CDC), About LGBT Health, 2014.
https://www.cdc.gov/lgbthealth/about.htm


